Power BI
Description
What is Power BI
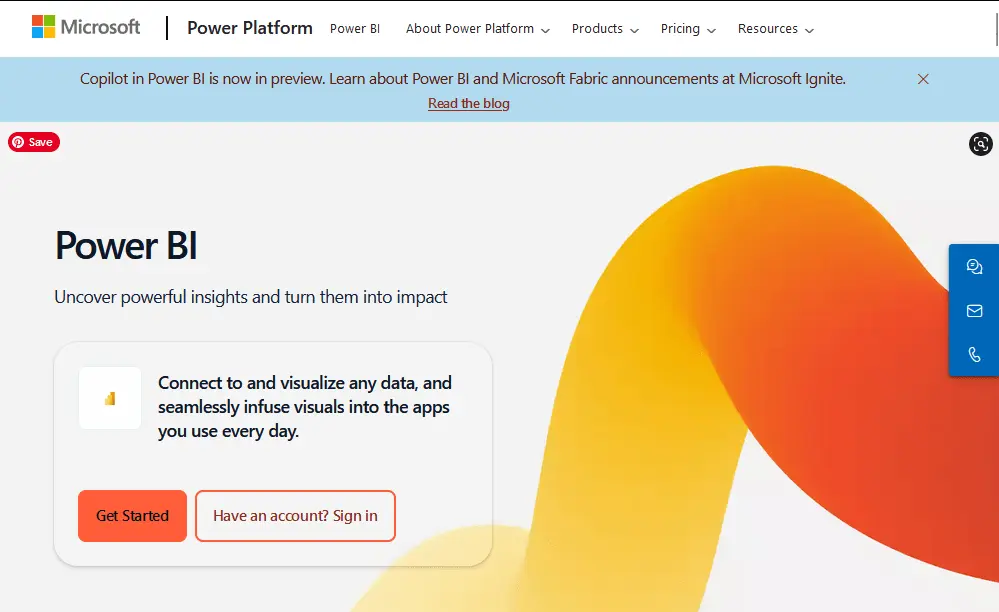
'Power BI' एक माइक्रोसॉफ्ट द्वारा विकसित एक बिजनेस एनालिटिक्स (business analytics) टूल है, जो आपको डेटा को विज़ुअलाइज़ (visualize)करने, एनालाइज़ (analyze) करने और शेयर करने में मदद करता है।
यह आपको विभिन्न स्रोतों से डेटा को एक साथ लाने, उन्हें समझने में आसान बनाने के लिए चार्ट और ग्राफ बनाने और अपने निष्कर्षों को दूसरों के साथ साझा करने की अनुमति देता है।
सरल शब्दों में, पावर बीआई डेटा को देखने, समझने और कार्रवाई करने का एक शक्तिशाली तरीका है। इसमें अनेक चार्ट्स, ग्राफ़, और मैप्स उपलब्ध होते है जो आपको डेटा को सुंदर और समझने में आसान बनाने में मदद करता हैं। इस AI Tool का आप निशुल्क उपयोग कर सकते हैं लेकिन कुछ advanced features का उपयोग करने के लिए पैकेज भी ले सकते हैं।
Features of Power BI
Data Connectors
'Power BI' विभिन्न डेटा स्रोतों से जुड़ सकता है, जैसे कि एक्सेल, सीएसवी फाइलें, डेटाबेस, क्लाउड सेवाएं और बहुत कुछ।
Data Transformation
आप अपने डेटा को इसकी सहायता से आसानी से ट्रांसफॉर्म कर सकते हैं और उसका मॉडल बना सकते हैं।
Dashboard Creation
आप अपने डेटा का संक्षिप्त अवलोकन प्रदान करने के लिए डैशबोर्ड बना सकते हैं। डैशबोर्ड विभिन्न विज़ुअलाइज़ेशन (visualizations) को एक साथ जोड़ने में मदद करता हैं।
Mobile Support
'Power BI' मोबाइल ऐप की भी सुविधा देता है, जिससे आप अपने डेटा को कहीं से भी एक्सेस कर सकते हैं। और इसका आप आसानी से उपयोग कर सकते हैं।
User Case of Power BI
Data Visualization
'Power BI' में विभिन्न प्रकार के चार्ट्स, ग्राफ़, और मैप्स का समर्थन प्राप्त होता है, जिससे आप अपनी रिपोर्ट को और भी अधिक आकर्षक बना सकते हैं।
Reporting and Sharing
आप अपने डेटा पर रिपोर्ट बना सकते हैं और उसे दूसरों के साथ आसानी से शेयर भी कर सकते हैं।
Data Analysis
यह आपके डेटा में पैटर्न और रुझानों को खोजने के लिए कई advanced features प्रदान करता है। आप फ़िल्टर लागू कर सकते हैं, ड्रिल डाउन कर सकते हैं और डेटा के विभिन्न क्षेत्रों की तुलना कर सकते हैं।
How to Use Power BI
- सबसे पहले आपको अपने browser में “Microsoft Power BI” search करना है।
- Microsoft की official website से 'Power BI' Desktop को download करें।
- इंस्टाल करने की प्रक्रिया को फॉलो करें।
- 'Power BI' ओपन करे।
- होम टैब पर जाएं और 'Get Data' पर क्लिक करें।
- अपने डेटा स्रोत को चुनें, जैसे एक्सेल फ़ाइल, डेटाबेस, वेब डेटा इत्यादि।
- और डेटा स्रोत के अनुसार कनेक्शन सेटअप करें।
- रिपोर्ट में जाए और विज़ुअलाइज़ेशन को ड्रैग-एंड-ड्रॉप करके जोड़ें।
- विज़ुअल एलिमेंट्स (Visual elements) को चार्ट, ग्राफ़, टेबल आदि को अपने अनुसार कस्टमाइज भी किया जा सकता है।
- रिपोर्ट तैयार होने के बाद इसे डैशबोर्ड पर शेयर करें।
- आप अपनी रिपोर्ट को 'Power BI Service' पर पब्लिश भी कर सकते हैं ताकि आप अपने डैशबोर्ड को ऑनलाइन एक्सेस कर सकें।
Package
| Free |
| $0/user per month |
Create rich, interactive reports that put visual analytics at your fingertips using Power BI, included in your free account for Microsoft Fabric Preview.
|
| Power BI Pro |
| $10/user per month |
License individual users with modern, self-service analytics for publishing reports and dashboards and viewing content across your organization.
|
| Power BI Pro |
| $10/user per month |
License individual users with access to larger model sizes, more frequent refreshes, XMLA read/write, deployment pipelines, and other enterprise-scale features.
|
Disclaimer: All information has been taken by tools owner websites. Which is publicly available for everyone?
we are just providing information for educational purpose so you can make informed decision.
we (AiAdvanceTools.com) are not responsible for any issue or legal concern.
you should visit tool`s website respectively before using them.
Plan & Pricing
Review
Write a ReviewThere are no reviews yet.


Review
Write a ReviewThere are no reviews yet.